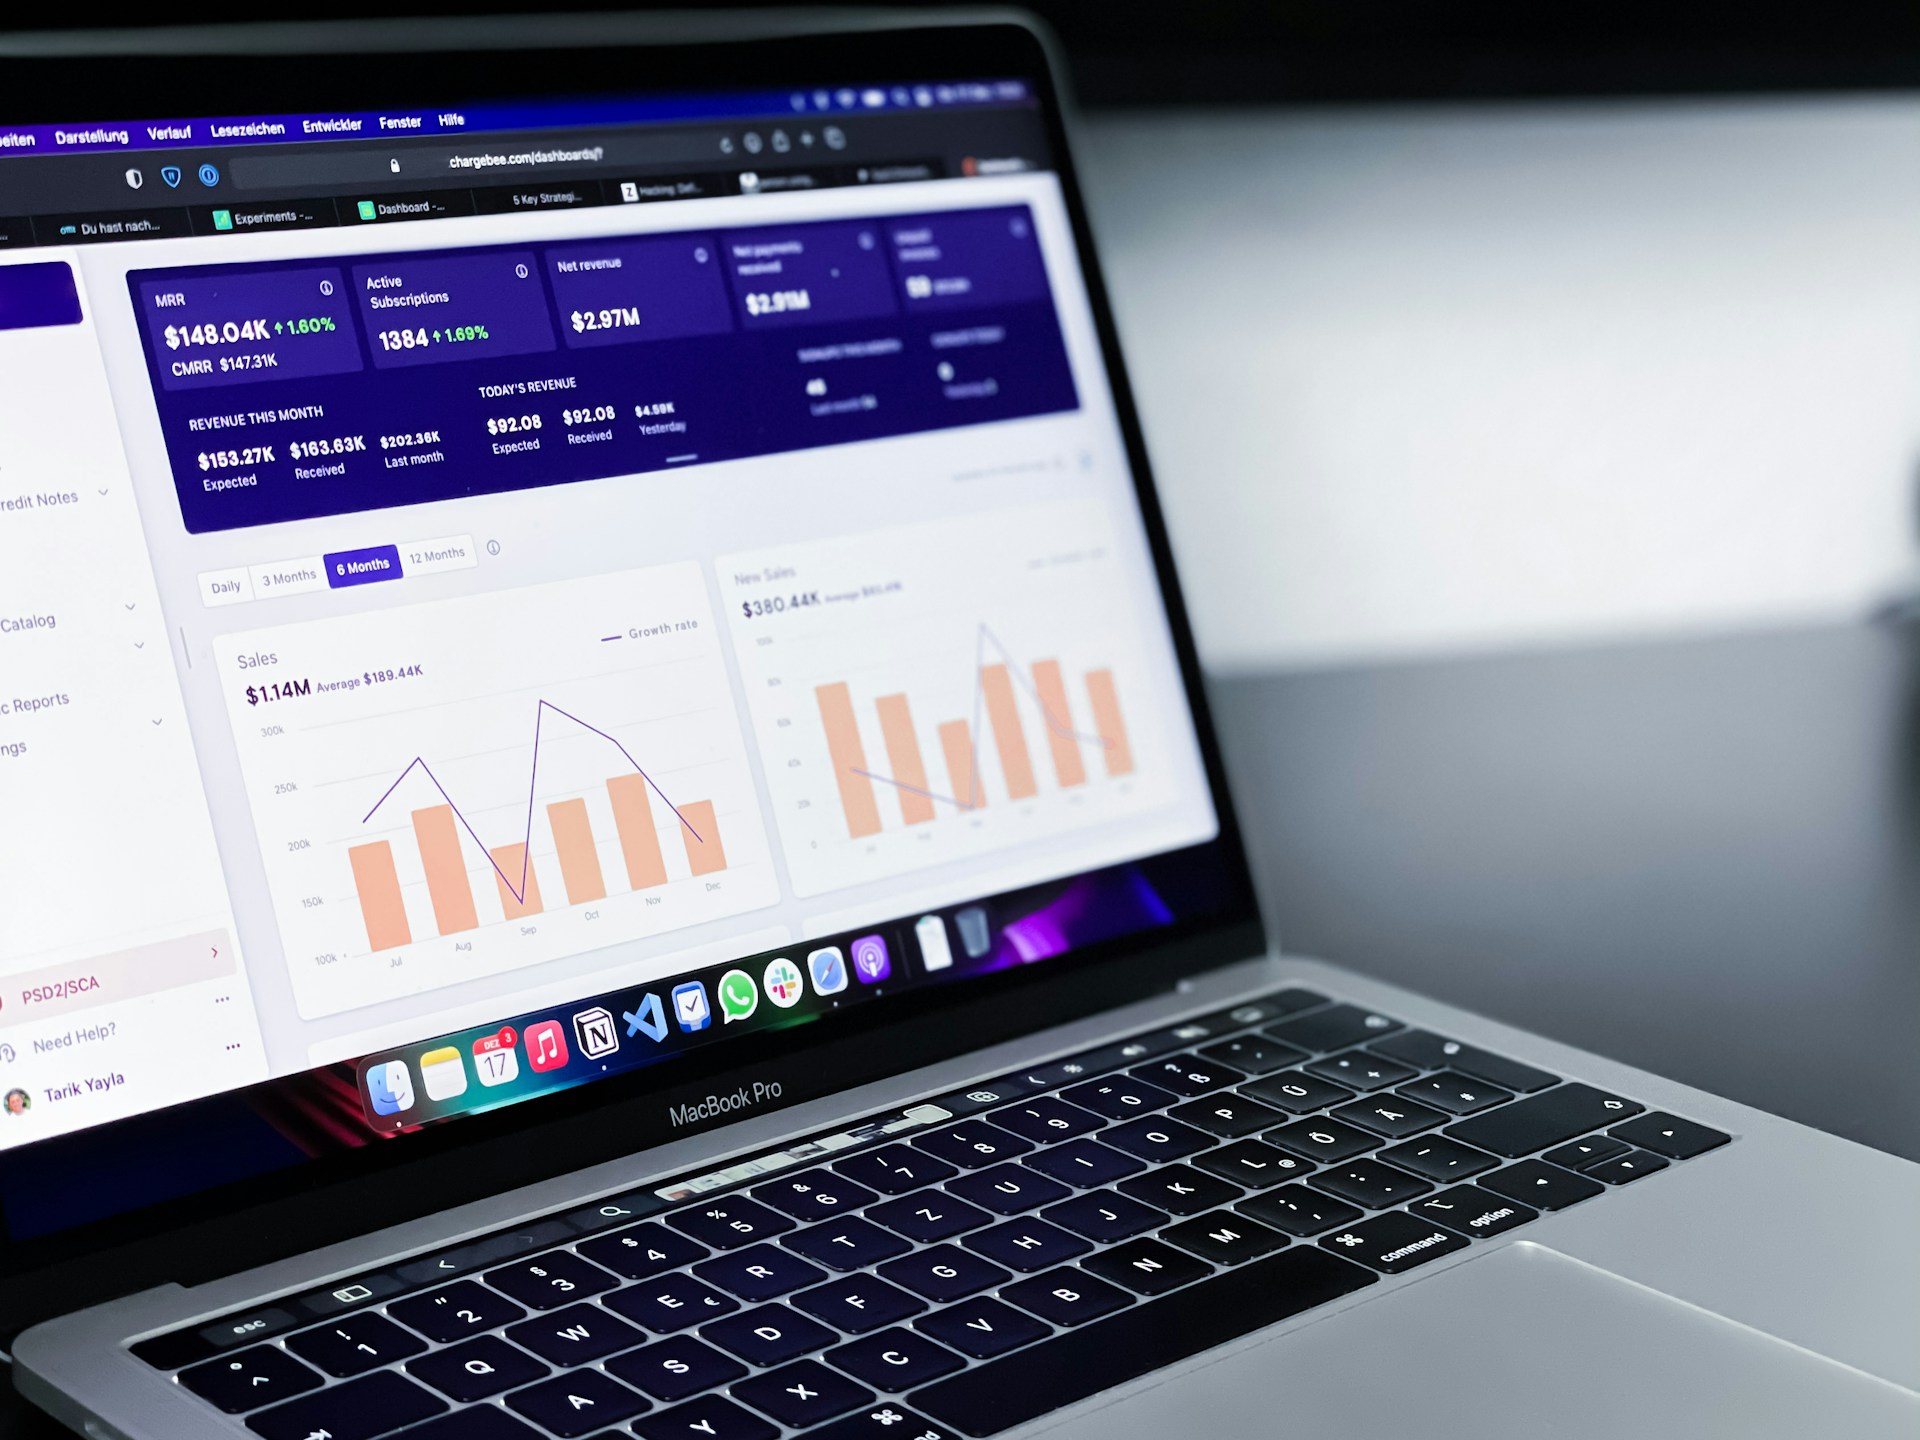
Transform Financial Data into Business Intelligence in Minutes, Not Days
Join 500+ businesses saving 10+ hours per month on financial and operational reporting with our reporting solution explicitly built for Quickbooks, SAP Business One Users, and NetSuite
Tackling Reporting Challenges
We solve reporting challenges you face every day with QuickBooks, SAP Business One and Netsuite users effectively.
Limited Customization Options
Lack flexibility in adding or removing fields, apply advanced filters, or modify layouts to meet unique reporting needs.
Extracting real-time data, especially data from multiple years, can be slow and cause excel to crash.
Many users resort to exporting data to Excel for further manipulation due to the limitations in native reporting tools. This manual process increases the risk of errors and is time-intensive.
Performance Issue with Excel
Dependence on Manual Workarounds
Lack of Consolidated Reporting
Disconnected Data
Inadequate Customer Support
Poor Data Visualization
Lack of Advanced KPI
Labor Intensive Reconciliation
Struggles with consolidated financial reporting for businesses managing multiple entities.
When reporting issues arise, users frequently complain about slow and unhelpful customer support responses. Many feel their concerns are not prioritized or adequately addressed.
Native visualization tools are bare bones. Users find it challenging to present data in visually engaging formats that support effective decision-making.
Integrating data from various sources is difficult and often results in inconsistencies and errors in reporting. Diverse data formats and a lack of uniformity in data entry standards.
Provide basic KPI tools, they often fall short in delivering the dynamic, multi-dimensional metrics modern businesses require.
The system forces teams to rely on tedious manual processes—sifting through endless spreadsheets and matching transactions by hand. This inefficiency drains valuable resources, turning reconciliation into a costly bottleneck.
Empowering Businesses Through Reporting Optimization
Vermis Analytics provides customizable reporting, automated reconciliation, and real-time dashboards to transform your financial data into actionable intelligence. Stop wasting time on manual processes and gain the clarity you need to grow your business.
Do you find yourself frustrated by the limited report customization options in QuickBooks?
Are you spending countless hours manually reconciling data across different systems like your e-commerce site, CRM, and MS Excel files ?
Are you tired of multiple clicks to find specific information quickly?


Transformative reporting management solutions.
Vermis Analytics
"
How We Help You
Vermis Analytics offers a powerful yet user-friendly solution to these challenges. We empower you to:


Advanced custom reports
that combines the exact data you need from QuickBooks and SAP Business One.
Automated Reconciliation
between any data and your accounting systems( Quickbooks, SAP Business One) and streamline processes to save time and reduce errors.
Gain real-time visibility
Into your financial and operations health with intuitive dashboards and analytics
Vermis Analytics transformed our financial operations with their tailored QuickBooks solutions. Their expertise in dashboard analytics has significantly improved our decision-making process. Highly recommended!
Francisco Perez-Matos

★★★★★
Insights
Optimize your reporting with our AI-powered solutions.
1410 Brickell ave # 910
Connect
info@vermis.io
+1-305-785-1595
Vermis Analytics 2025. All rights reserved.
Miami, fl 33131
